
Running an agency can feel like you’re constantly putting out fires—client demands, team capacity, unexpected costs—and somewhere in all that chaos, profitability becomes this elusive thing you hope you’re getting right.
But hope isn’t a strategy. If you don’t know where your margins stand or what’s driving (or draining) your profit, you’re flying blind.
The good news? Fixing profitability doesn’t have to be overwhelming. In fact, it comes down to understanding just three key metrics. Once you know how these work, you’ll see exactly where to focus your energy.
That’s where BugHerd partner Parakeeto comes in. They’ve built their entire platform and methodology around helping agencies gain clarity on their performance, without spending hours digging through spreadsheets.
Whether you're struggling with scope creep, team utilization, or figuring out which clients are actually profitable, Parakeeto helps agencies make smarter decisions and run a healthier, more scalable agency.
Let’s break it all down.
Why Agencies Struggle With Profitability
Most agencies start with a simple goal: do great work and make enough money to keep the lights on. But as your agency grows, complexity creeps in—more people, more clients, more processes—and without a solid grip on your numbers, profit can slip away before you even notice.
That’s why many agencies hit a wall. Revenue grows, but margins shrink. You might feel like your team is working harder than ever, but the numbers aren’t adding up.
The problem isn’t your talent or your hustle—it’s that most agencies don’t know where to start when it comes to tracking and improving profitability.
That’s where these essential metrics come in.
Delivery Margin
Parakeeoto has been working with agencies since 2018, and has had the opportunity to evaluate 100’s of firms in that time.
What might surprise you is that over 90% of those firms failed to meet their profitability targets for the same reason, which can be attributed to one simple metric.
This metric is something they call Delivery Margin.
Delivery Margin answers one simple and important question:
“How much does it cost us to deliver on the promises we make to clients?”
It does this by isolating two important things:
- Agency Gross Income (AGI)
Agency Gross Income (AGI) measures the amount of revenue collected from clients that is your firm's responsibility to earn using your internal resources and time.
This is calculated by deducting Pass-Through Expenses from Total Revenue.
Pass-Through expenses represent money you collect from clients, that immediately passes through your agency onto other vendors. Common examples include:- Media spend
- Print spend
- External contractors doing work we otherwise wouldn’t do internally
- Whitelabel partners
- Travel & material expenses
- Etc.
- Delivery Expenses
The second key ingredient to measuring Delivery Margin is understanding your Delivery Expenses. This is accomplished by isolating all the expenses that go into the Delivery Function of your business (doing work directly for clients).
This will mostly be made up of payroll allocations for your team. Some people on the team will have 100% of their salary allocated to the delivery function of the business, while others might only be partially allocated, and have part of their salary allocated to overhead functions such as sales & marketing and administration.
Calculating Delivery Margin
Once you’ve isolated the two inputs to Delivery Margin, all that’s left to do is calculate it:
Formula: Delivery Margin = (AGI - Delivery Expenses) ÷ AGI
For example, if your agency does $1M in revenue and has $400k in Delivery Expenses, you would have a delivery Margin of 60%.
Benchmark: The goal is to keep the delivery margin over 50% of AGI for the whole agency. This leaves enough margin leftover to pay for overhead (usually 20-30% of AGI) and leave you with a 20%+ Profit.
If you’ve got a finance background, you might be thinking “Delivery Margin seems a lot like Gross Margin or Contribution Margin, why not just call it that?”
The short answer is … it’s just semantics. Many agency P&Ls are structured such that COGS are used to isolate Pass-Through Expenses, which means Gross Profit is actually representative of AGI.
That’s not inherently problematic, but it does lead to confusion if we’re using the same language to describe something that is fundamentally different - so Parakeeto just decided to call Delivery Margin something else.
The Challenge with Delivery Margin
The number one reason firms struggle with profitability is that they fail to accomplish a 50%+ Delivery Margin on their P&L. As such, no matter how efficient they are with their overhead spending, they’re often still struggling to achieve a strong bottom line.
The question then becomes, how do you improve Delivery Margin and get up over the 50% benchmark?
Below is a breakdown of the only 3 ways to improve delivery margin, using 3 Key Metrics.
The best part of these metrics is that they don’t require you to rely on finance and accounting data, and can be measured quickly and easily using data your agency is likely already creating every day.
Let’s jump in!
The 3 Key Metrics That Drive Agency Profitability
If you only track three things this year, make it these:
1. Average Billable Rate (ABR)
Think of ABR as a measure of efficiency. It tells you how much revenue your team generates for every hour they work.
Formula: ABR = AGI ÷ Delivery Hours
Here’s the question to ask: How much revenue does your agency earn for each hour of effort it invests in client work?
Example: If you sell a project for $20,000 and it takes your team 100 hours to complete, your ABR is $200/hour. Now imagine if you could complete that same project in 80 hours instead—your ABR jumps to $250/hour.
If your agency has 10,000 hours of delivery capacity per year, that means you could earn an extra $500,000 in revenue without changing your pricing or the size of your team!
You can use this metric to measure any time period in your business (weeks, months, quarters, years) and slice work any way you’d like (clients, projects, departments, the whole agency, etc.)
It’s a simple and easy way to see what kinds of work are more efficient at earning revenue than others.
How to improve ABR:
- Charge more: Raise prices without relatively increasing the scope of work.
- Work less: Find ways to complete the same work in less time, without relatively decreasing your price.
Benchmark: Your ABR should be at least 3x your Average Cost Per Hour (ACPH) to ensure you are set up for healthy margins, and are within striking distance of your 50% Delivery Margin target on the P&L.
2. Average Cost Per Hour (ACPH)
This tells you what an hour of labor costs your firm on average, including salaries, benefits, and payroll taxes.
Formula: ACPH = Total Payroll Cost ÷ Total Annual Capacity
Just like ABR, this formula can be applied to any time period, and to any portion of your team (individuals or entire teams).
Here’s why ACPH matters: If your ABR is $200/hour but your ACPH is $150/hour, your margins won’t be high enough to run a profitable business. Having a high ACPH can force you into pricing that makes your firm uncompetitive.
Lowering ACPH is also an effective way to increase your margins without raising prices, which is useful when you’re already facing a lot of pricing pressure or competition.
How to reduce ACPH:
- Leverage junior talent: Assign less complex tasks to team members with lower costs per hour.
- Standardize processes: Create SOPs so junior or offshore talent can handle more work effectively.
Healthy ACPH should be less than around ⅓ of your ABR, which creates enough room for solid profitability.
3. Utilization
Utilization measures how much of your team’s capacity is spent on revenue-generating work.
Formula: Utilization = Delivery Hours ÷ Total Capacity
Definitions:
Delivery Hours: Any time spent doing client work, regardless of whether or not it was “billed” to the client.
Total Capacity: All of the time being purchased from the employees being measured in that time period, including paid time off, holidays, non-delivery time, etc.
Just like the other two metrics, the same formula can apply to any period of time, and any part of your team.
Let’s break it down: If a designer works 40 hours a week and spends 30 hours on delivery tasks, their utilization is 75%.
Here’s the catch: while higher utilization sounds great, it’s important to balance it with team well-being. Burnout and team turnover isn’t profitable.
How to improve utilization:
- Increase Delivery Hours: Keep your pipeline steady so your team stays busy but not overwhelmed.
- Right-Size the Team: If you can’t sell enough work to keep the team busy, consider downsizing the team to match the work available, and using contractors or freelancers to handle short or unexpected bursts.
- Reduce non-delivery work: Use tools or automation to help reduce the amount of time your team needs to spend on things that aren’t related to delivering work for clients.
Agency-wide utilization of 50–60% annually is healthy, but for your delivery team, aim for 70–90% as a standard weekly target for individuals.
Bringing it Together
Let’s go through an example of how these metrics can impact profitability:
Imagine we have an agency with the following model:
- 100,000 hours of capacity (roughly a 50 person team)
- $3M in Delivery Expenses
- $1.5M in Overhead Expenses
We can calculate their AGI, Delivery Profit and Net Profit using the following formulas:
- Capacity x Utilization x ABR = AGI
- Delivery Profit is AGI - Delivery Expenses
- Profit is (AGI - Delivery Expenses) - Overhead Expenses
Watch how small improvements in Utilization and ABR massively increase their profitability, without any changes to their overhead costs or team costs.

This example illustrates the power of these simple metrics, and their impact on Delivery Margin.
Next Steps: Resources for Measuring & Improving Agency Profitability
Understanding these metrics is one thing. Tracking and improving them is another. That’s why Parakeeto created the Agency Profit Toolkit — a free resource that gives you everything you need to take control of your numbers.
Here’s what’s inside:
- Templates: Easily calculate ABR, ACPH, and Utilization for your agency.
- Cheat Sheets: See at a glance what healthy margins look like.
- Video Guides: Learn step-by-step how to implement changes and boost profitability.
Thousands of agencies have used this toolkit to stop guessing about their margins and start growing profitably. Now it’s your turn.
Download the toolkit here and get started today
Closing Thoughts
Profitability isn’t about working harder—it’s about working smarter. By focusing on ABR, ACPH, and Utilization, you’ll unlock the insights you need to make better decisions, grow sustainably, and build an agency that thrives in 2025 and beyond.
The numbers don’t lie, and neither does the impact they’ll have on your business. So why not start today?
To find out more about how to fix your agency’s profitability problems head to: https://parakeeto.com

Marcel Petitpas
Try BugHerd on your site
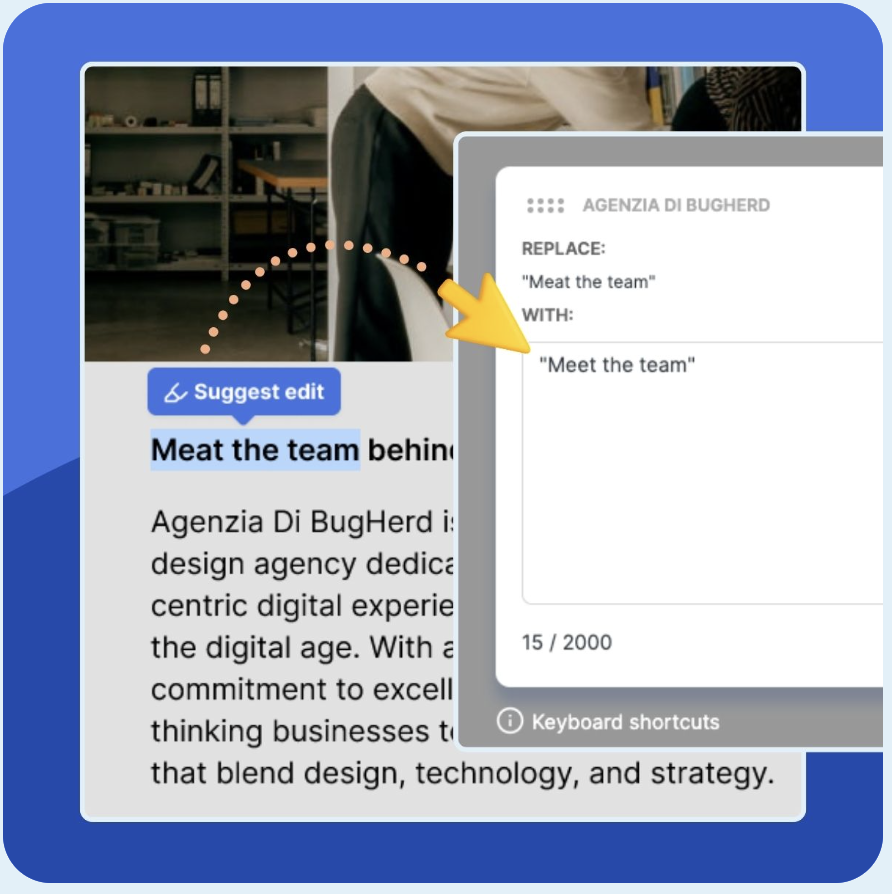
See feedback in context
Click anywhere to leave feedback directly on your website.


But don't just take our word for it.
BugHerd is loved by 10,000+ companies,
350,000+ users across 172 countries.
4.8/5
4.7/5
4.5/5
5/5
8.7/10
Sam Duncan 📱📏 🌱
@SamWPaquet
"@bugherd where have you been all my life??
We just migrated our bug tracking over from Asana and have at least halved our software testing time🪳👏📈. "
Ashley Groenveld
Project Manager
“I use BugHerd all day every day. It has sped up our implementation tenfold.”
Sasha Shevelev
Webcoda Co-founder
"Before Bugherd, clients would try to send screenshots with scribbles we couldn't decipher or dozens of emails with issues we were often unable to recreate."
Mark B
Developer
“A no-brainer purchase for any agency or development team.”
Kate L
Director of Operations
"Vital tool for our digital marketing agency.”
Paul Tegall
Delivery Manager
"Loving BugHerd! It's making collecting feedback from non-tech users so much easier."
Daniel Billingham
Senior Product Designer
“The ideal feedback and collaboration tool that supports the needs of clients, designers, project managers, and developers.”
Chris S
CEO & Creative Director
“Our clients LOVE it”
Emily VonSydow
Web Development Director
“BugHerd probably saves us
at least 3-4hrs per week.”